Java performance and CPU Cache
The CPU cache has a big impact on the performance of an application. This is discussed in great detail in the document “What Every Programmer Should Know About Memory”, which gives a deep look into the innards of a modern CPU. For Java developers, however, optimizations of their own program code in this regard are rarely purposeful.
All information in this article is in principle language-independent and applies to all programming languages. However, most examples are written in C/C++ and are not transferable 1:1 to Java. In this article, we address the question of the cases in which Java programs can benefit from the CPU cache. The prevailing opinion is that one should not try to explicitly optimize the application for it. But why not? Where is the limit?
Java hides a lot of information about low-level operations from the developer, who therefore doesn’t have to worry about much of it. This makes Java an easy language to learn, where the developer doesn’t have to worry about the lifecycle of objects or mess with pointers right from the start. Through the Virtual Machine, runtime optimizations can be done under the hood that are not possible with a compiled language like C++. However, just these can destroy all optimization attempts.
A small warning in advance: before dealing with CPU caches, one should have understood algorithms and their complexity. Performance problems are much more often caused by wrongly chosen or implemented algorithms than by an unused CPU cache. Before I get to the performance tests, some background information:
Memory.
In Java, you have no control over where on the heap a block of memory is allocated. However, you can assume that an array or an object is allocated as a block of memory. Some influence can be had via the command line parameters such as -XX:+UseTLAB, -XX:+UseLargePages, .... What impact these have on performance and when they are worthwhile would also be an interesting topic, but too far at this point.
Garbage Collector
The Garbage Collector (GC) is certainly the most important feature in Java. It simplifies the memory management massively, so that applications without memory holes can be written even by beginners. The fact that every memory-relevant aspect of an object that affects runtime is known also makes analysis much easier than in C++, for example. Currently, there are several different GCs with a variety of options that can be used to meet a wide range of requirements. But the GC cleans up not only objects, but has still more functions, which complicate explicit optimizations.
Simple tests
We’ll start with a few simple memory access tests and then move on to a simple routine that adds a motion vector to a coordinate. The first test is a loop and has the first error. Here I used long instead of long out of habit. How much the performance is affected by this can be seen in the following example. If speed is needed, you should always use primitive datatypes in calculations or for mutable data.
Object cs. Primitive Type
 1    long sum = 0L;
 2    for(int i = 0; i < size; i++) {
 3        sum++;
 4    }
 5
 6    >> Time: 0.013913 s
 7
 8    Long sum = 0L;
 9    for(int i = 0; i < size; i++) {
10        sum++;
11    }
12
13    >> Time 2.162704 s
here are quite a few web sites dealing with performance and also frameworks that simplify performance testing.
Array accesses
The first test is a simple access to arrays of different sizes. The size of the array is doubled on each run, while the number of accesses always remains the same (100,000,000 in my example). The second test does not access sequentially, but uses a random pattern stored in a second array of the same size.
Array Access
 1    public static Long testOffsetArrayAccess(int maxAccess, int size,
 2                                             float[] array) {
 3        float sum = 0;
 4        int andSize = size - 1;
 5        for (int i = 0; i < maxAccess; i++) {
 6            int pos = i & andSize;
 7            sum += array[pos];
 8        }
 9        return (long) sum;
10    }
11
12    public static Long testRandArrayAccess(int maxAccess, int size,
13                                        float[] array, int[] rand) {
14        float sum = 0;
15        int andSize = size - 1;
16        for (int i = 0; i < maxAccess; i++) {
17            int pos = rand[i & andSize];
18            sum += array[pos];
19        }
20        return (long) sum;
21    }
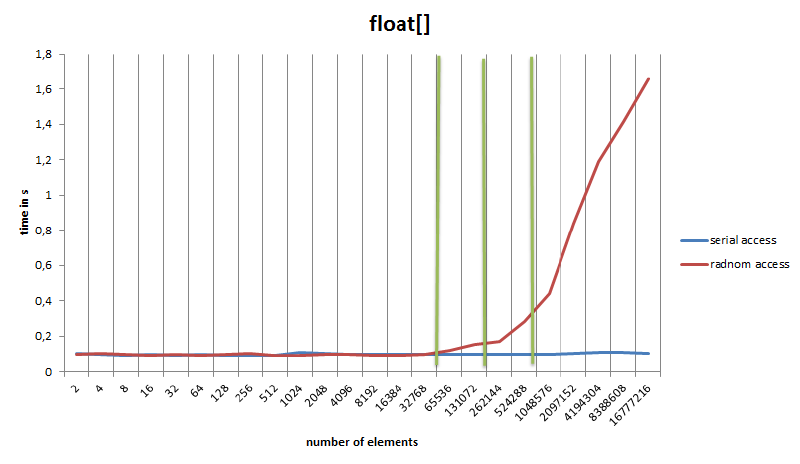
The measured times are shown in the following graph.

Array accesses
The graph reveals some interesting details:
- The minimum time for an access in this example is 0.9 ns.
- A similar test in C yielded the same access time of about 0.9 ns, but this is also not surprising since the Just-In-Time (JIT) produces very similar code to the C compiler. Java should actually be a bit slower, since it is still checking array bounds, but the duration of the memory access seems to mask this.
- The access time for serial access remains the same throughout the series of tests. While the processor is adding the data, the next memory cells are already being loaded into the cache in the background (Prefetching).
- Accessing the second array with the random numbers has no effect on the total duration for small sizes.
- Random access then breaks at about 256KB and 1MB respectively on my processor, which corresponds exactly to the L1/L2 cache sizes. The green lines represent the cache limits.
Side note: The same test was also done in C where the code generated by GCC is three times faster than the Java code. In this first version, % (modulo) was used instead of & (and) when accessing the array in Java and C. Modulo is converted to an idiv in Java, while GCC produces an optimized version without division.
As in C/C++, the influence of the CPU cache can be shown for arrays in Java. But what happens when objects are used?
Object accesses
This part is completely dedicated to objects. Here a motion vector is added to a 3D position and stored back again. So a total of six float variables are read and three of them are overwritten. The objects are stored in two ArrayLists. Unfortunately Java does not provide object arrays like C++ (std::vector<T>) but only arrays of primitive types. The ArrayList at least stores the pointers in an array and thus corresponds to a std::vector<T *>. During the test run no objects are created or destroyed.
The first test is quite simple:
Object Access
 1    public static Long testSerialECSAccess(int maxAccess, int size,
 2                                         ArrayList<Position> positions,
 3                                           ArrayList<Movement> movements) {
 4        int andSize = size - 1;
 5        for (int i = 0; i < maxAccess; i++) {
 6            int pos = i & andSize;
 7            Position position = positions.get(pos);
 8            Movement movement = movements.get(pos);
 9            position.x += movement.x;
10            position.y += movement.y;
11            position.z += movement.z;
12        }
13        return 0L;
14    }
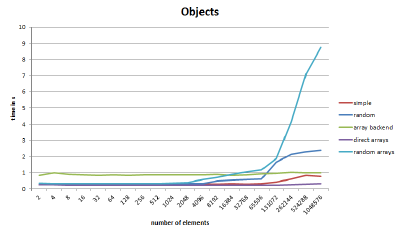
The result is marked as “simple” in the graph.

Object accesses
Again, the array size changes, but the number of accesses remains the same. As can be seen in the graph, the total time increases after 65,000 elements. This corresponds to about 3.6 MB of memory, and the next step is already above the 6 MB limit of the L3 cache. The Size of an element is composed of 2 objects (Position, Movement) with 24 bytes each and two ‘ArrayList’ pointers to the objects with 4 bytes each (Compressed Oops), which results in 56 bytes.
It would be naive to assume that the data are all arranged sequentially in the memory, but the fact that there is a slight increase as with a random access is surprising at first. After all, the data was all generated serially, is retrieved in the same order, and there are no threads running in parallel.
With a small method you can get the memory addresses of the objects. The following code generates 10,000 object pairs:
Memory Adresses
1    ArrayList<Position> positions = new ArrayList<>(10000);
2    ArrayList<Movement> movements = new ArrayList<>(10000);
3    for (int i = 0; i < 10000; i++) {
4        positions.add(new Position());
5        movements.add(new Movement());
6    }
The objects are arranged in the memory at the end of the loop as follows (P = Position, M = Movement, number is the index in the array):
P0 M0 P1 M1 P2 M2 P3 M3 P4 M4 P5 M5 P6 M6 P7 M7 P8 M8 P9 ...
So, quite as expected. With 100,000 pairs, however, the result is surprising. The arrangement is now as follows:
M80600-M80200 P16400-P16000 M80200-M78000 ...
When explicitly calling the Gargabe Collector (GC) via System.gc() you always get this arrangement. So what happened?
It is a bug in the test setup. The Virtual Machine has decided to clean up memory after a few rounds of testing. If you set the VM to issue the GC calls every time, it becomes clear that the initialization of the larger arrays is not so smooth after all. It is interesting that the GC groups the objects by type. So it seems to have a certain love of order. But this slight disorder causes prefetching to fail from time to time.
The important lesson is that in Java, objects can be moved around in memory. If two objects are allocated one after the other and initially end up in the same memory area, they can still end up in completely different memory locations at some point. But it gets even crazier, so let’s take a look at the next graphs….
Random accesses
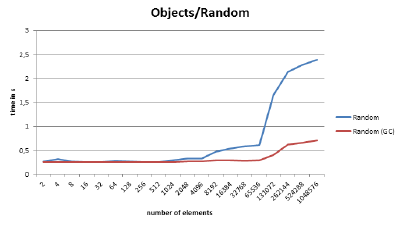
This test works basically like the previous one, except that on initialization the objects are inserted at random locations in the array. This time we avoided that the GC touches the objects by having enough memory already available at startup and an explicit GC call cleans up the memory before initialization. After that, you get the same behavior as with random access to the float array, and the performance collapses fast and hard. But what happens when the GC is called after initialization?

Random access
Oops - it’s faster? How does Java know that we are processing the array linearly? Now, when you print out the addresses of the objects again, you notice that they are suddenly sorted by the array index. It must be because of how Java organizes its Young/Old Generation memory spaces. According to Oracle moves the GC moves objects from Young to Old by starting from objects that are already in the Old memory area. Apparently, the array is already in Old space (because it was allocated first). Then the GC iterates over all the array elements (which in Java are pointers to other objects), moves the objects it finds into the Old area, and thus implicitly sorts them (and additionally groups them by type). Can you rely on this or perhaps cleverly provoke the process? Of course not, the differences between the various Java VMs alone would make this difficult.
Primitive Array Backend
Now how to optimize anyway, without resorting to obscure tricks that require knowledge of VM-internal operations? Java NIO, everything into one object or completely different? In the first part, accessing a float array was pretty fast and scaled well. So why not a facade to a couple of float arrays? That would still give us the object orientation and hopefully the fast access.
 1    public class PositionA {
 2        private final PosArrays arrays; // structure with 3 arrays
 3        private final int pos;
 4        PositionA(PosArrays arrays, int pos) { ... }
 5        public float getX() { return arrays.xp[pos]; }
 6        public float getY() { return arrays.yp[pos]; }
 7        public float getZ() { return arrays.zp[pos]; }
 8        public void setX(final float x) { arrays.xp[pos] = x; }
 9        public void setY(final float y) { arrays.yp[pos] = y; }
10        public void setZ(final float z) { arrays.zp[pos] = z; }
11    }
In this case we store all float arrays in the object PosArrays. The Position and Movement classes each get a reference to the arrays, as well as to the position in the arrays (comparable to an ID). The graph “array backend” shows the result: almost the same runtime over the whole test. A minimal degradation in performance can be observed here as well, but this is negligible compared to the poor overall performance. The reason for the poor overall performance is that the memory areas of the individual components are in completely different places. Previously, with a little luck, a position-and-movement object could fit in a cacheline, but now eight arrays (ArrayList<PositionA>, ArrayList<MovementA>, plus the six coordinate components) and two Facade objects must be transferred from memory/cache to the CPU before the actual operation can take place.
Direct Arrays
So get rid of the management structures and just use the coordinate arrays? The graph “direct arrays” performs the operations directly on the float arrays and voilà, the test has the same performance as our first approach (“simple”) and even outperforms it for large arrays! The object orientation is gone now, but we seem to have found the ideal solution. Or?
Random Arrays
What happens when the arrays are randomly accessed again? It goes haywire. Even with small array sizes, performance degrades and then plummets massively, as can be seen in the “random arrays” graph. Instead of one or two cache misses for the objects, we suddenly get a maximum of six of them. This completely throws off the CPU’s prefetch algorithm. The data locality plays a very big role here, and in this case using objects is the best solution for now.
